


 12 / 16

The Amish Voice 12
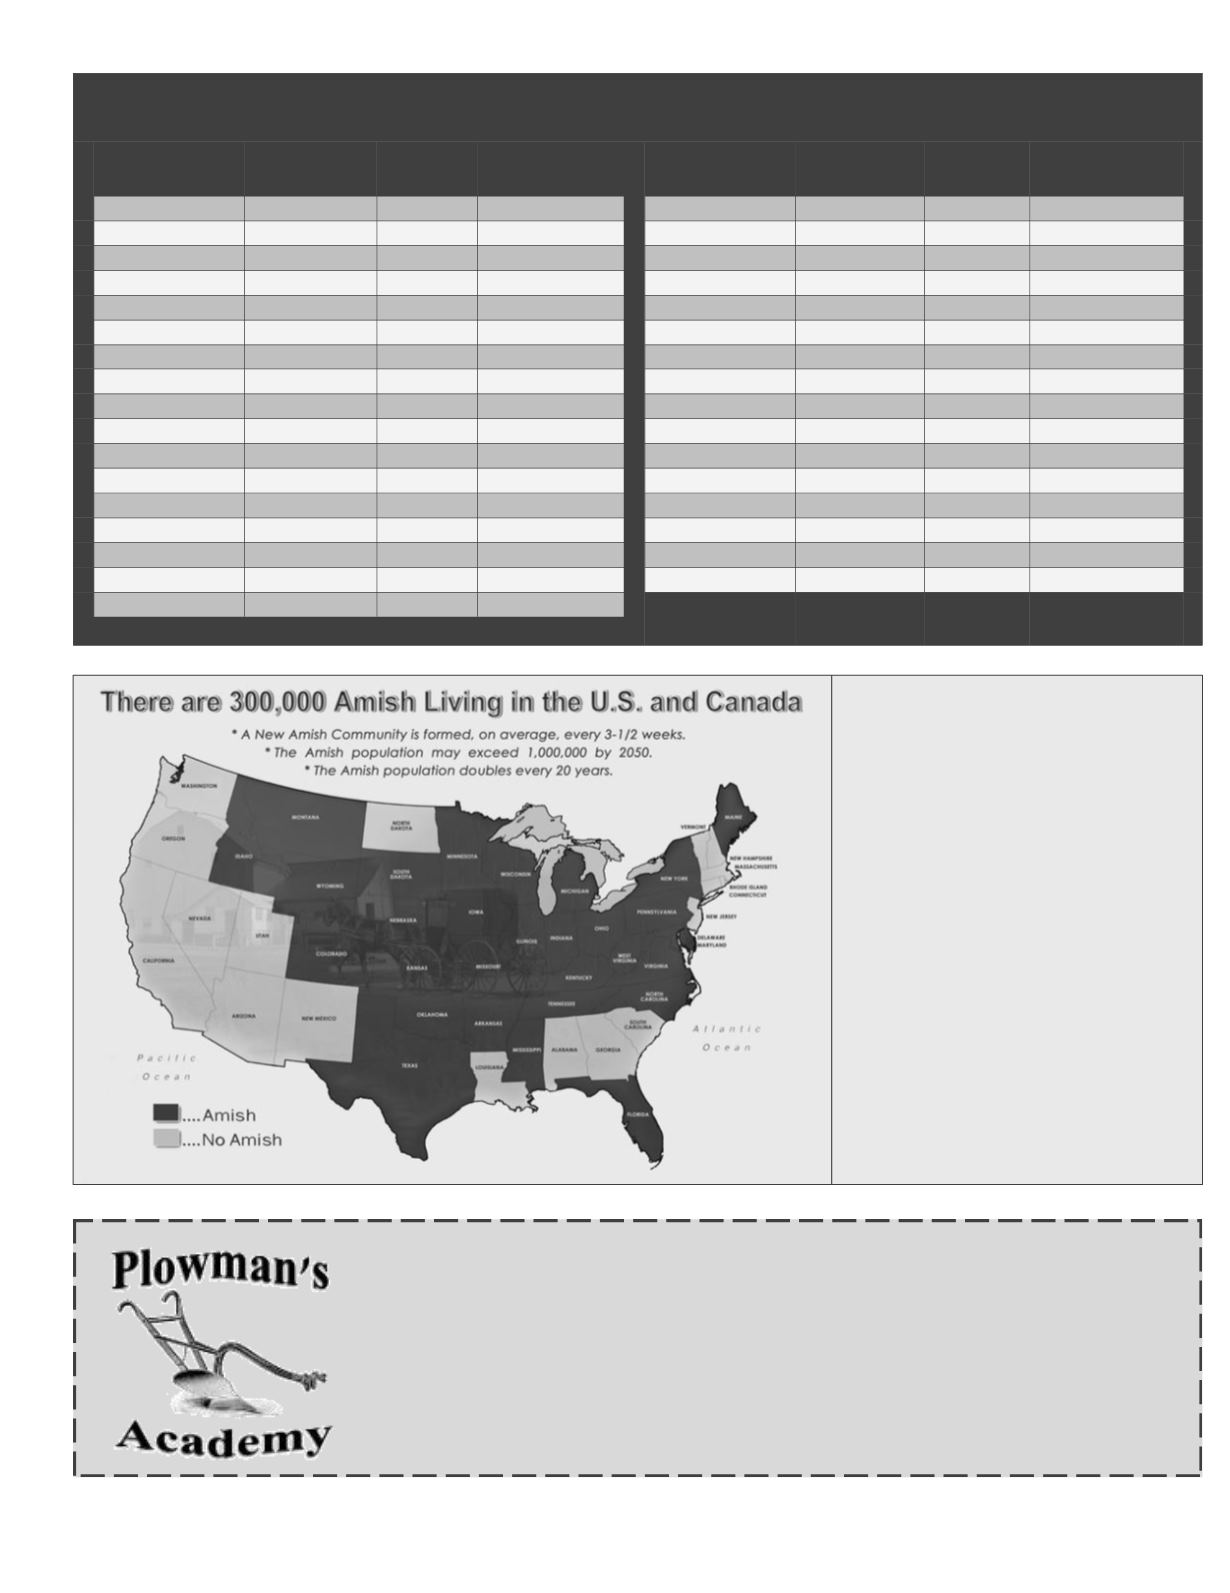
Population:
The Amish population
expanded 20.2% since 2010. It doubles
about every 18 to 20 years.
Settlements.
Seventy-four new settle-
ments (geographical communities) were
established since 2010.
Districts:
Since 2010, the number of
districts grew from 1,826 to 2,193, for a
net gain of 367.
Note:
The data includes all Amish
groups that use horse-and-buggy trans-
portation, but excludes car-driving groups
such as the Beachy Amish and Amish
Mennonites.
The information on this page was taken from: “Amish
Population Change 2010-2015, Summary.” Young
Center for Anabaptist and Pietist Studies, Elizabeth-
town College.
https://groups.etown.edu/amishstudies/files/2015/08/Population_Change_2010-2015.pdf.
Amish Population by State
State/Province
Settlements
Districts
Est Population
State/Province
Settlements
Districts
Est Population
Ohio
54
513
69,255
Nebraska
5
6
810
Pennsylvania
54
465
68,820
Oklahoma
3
6
810
Indiana
22
364
50,955
Colorado
3
5
675
Wisconsin
50
138
17,665
Maine
5
5
675
New York
52
128
17,280
Montana
4
4
540
Michigan
43
109
14,495
Arkansas
2
2
270
Missouri
43
96
11,230
West Virginia
3
3
225
Kentucky
43
86
11,010
Mississippi
1
1
150
Iowa
23
61
8,785
North Carolina
1
1
135
Illinois
18
52
7,280
South Dakota
1
1
95
Ontario
16
38
5,130
Florida
1
1
75
Minnesota
23
36
4,535
Texas
1
1
75
Tennessee
9
22
2,750
Idaho
1
1
75
Kansas
7
15
2,025
Wyoming
1
1
75
Delaware
1
10
1,500
New Brunswick
1
1
20
Maryland
3
11
1,485
Vermont
1
1
15
Virginia
6
8
1,080
Total
501
2,193
300,000
(Continued on next Column)
Free Bible Study Course
Enrollment Form
(see other side for details)